

Keeping track of sales performance is really important for growing your business and reaching your goals. Luckily, there are great software options available that work well with CRM systems and have helpful features for visualizing data and analyzing it.
These software tools give you valuable insights into your sales activities, pipeline indicators, and how well your team is doing.
In this article, we'll explore the top software tools for sales management that are known for their effectiveness in tracking performance. These tools combine popular CRM systems with features for visualizing data and analyzing it, so sales managers can make better decisions based on real information.
Let's dive into the world of sales management software and discover the tool stacks that can help businesses track their sales performance and achieve amazing success.
Salesforce + Tableau:
Salesforce is a powerful tool for managing sales processes. It automates tasks, tracks customer interactions, and handles pipelines. It centralizes sales data, enabling salespeople to manage leads, opportunities, and customers effectively. Salesforce tracks negotiations, predicts sales, and promotes teamwork and communication.
Tableau transforms sales data into visually appealing dashboards and reports. By integrating Salesforce CRM data into Tableau, you can optimize sales performance tracking. Tableau's user-friendly interface allows you to create custom visualizations and interactive charts tailored to your sales information.
Tableau's robust analytics uncover trends, patterns, and outliers in sales data. You can analyze data by time period, location, product category, and customer segment, enabling you to optimize your sales strategies.
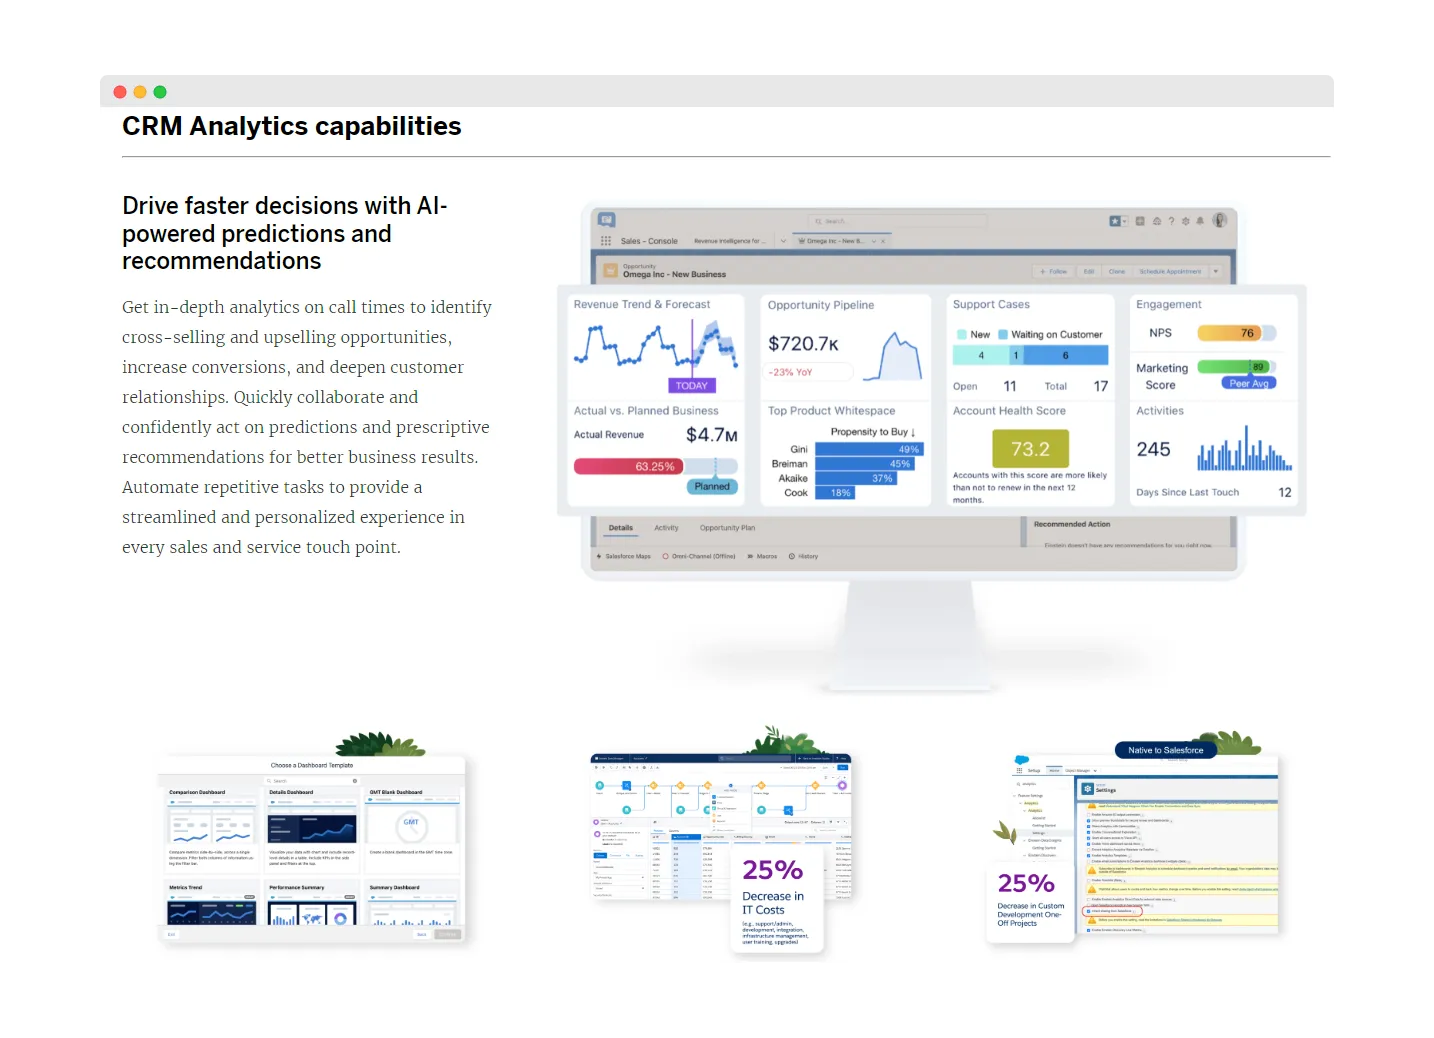
Combining Salesforce and Tableau improves sales performance tracking. Real-time sales data empowers sales managers and representatives to monitor progress, identify bottlenecks, and seize improvement opportunities. Manual data transfers and reconciliations are eliminated, saving time and effort.
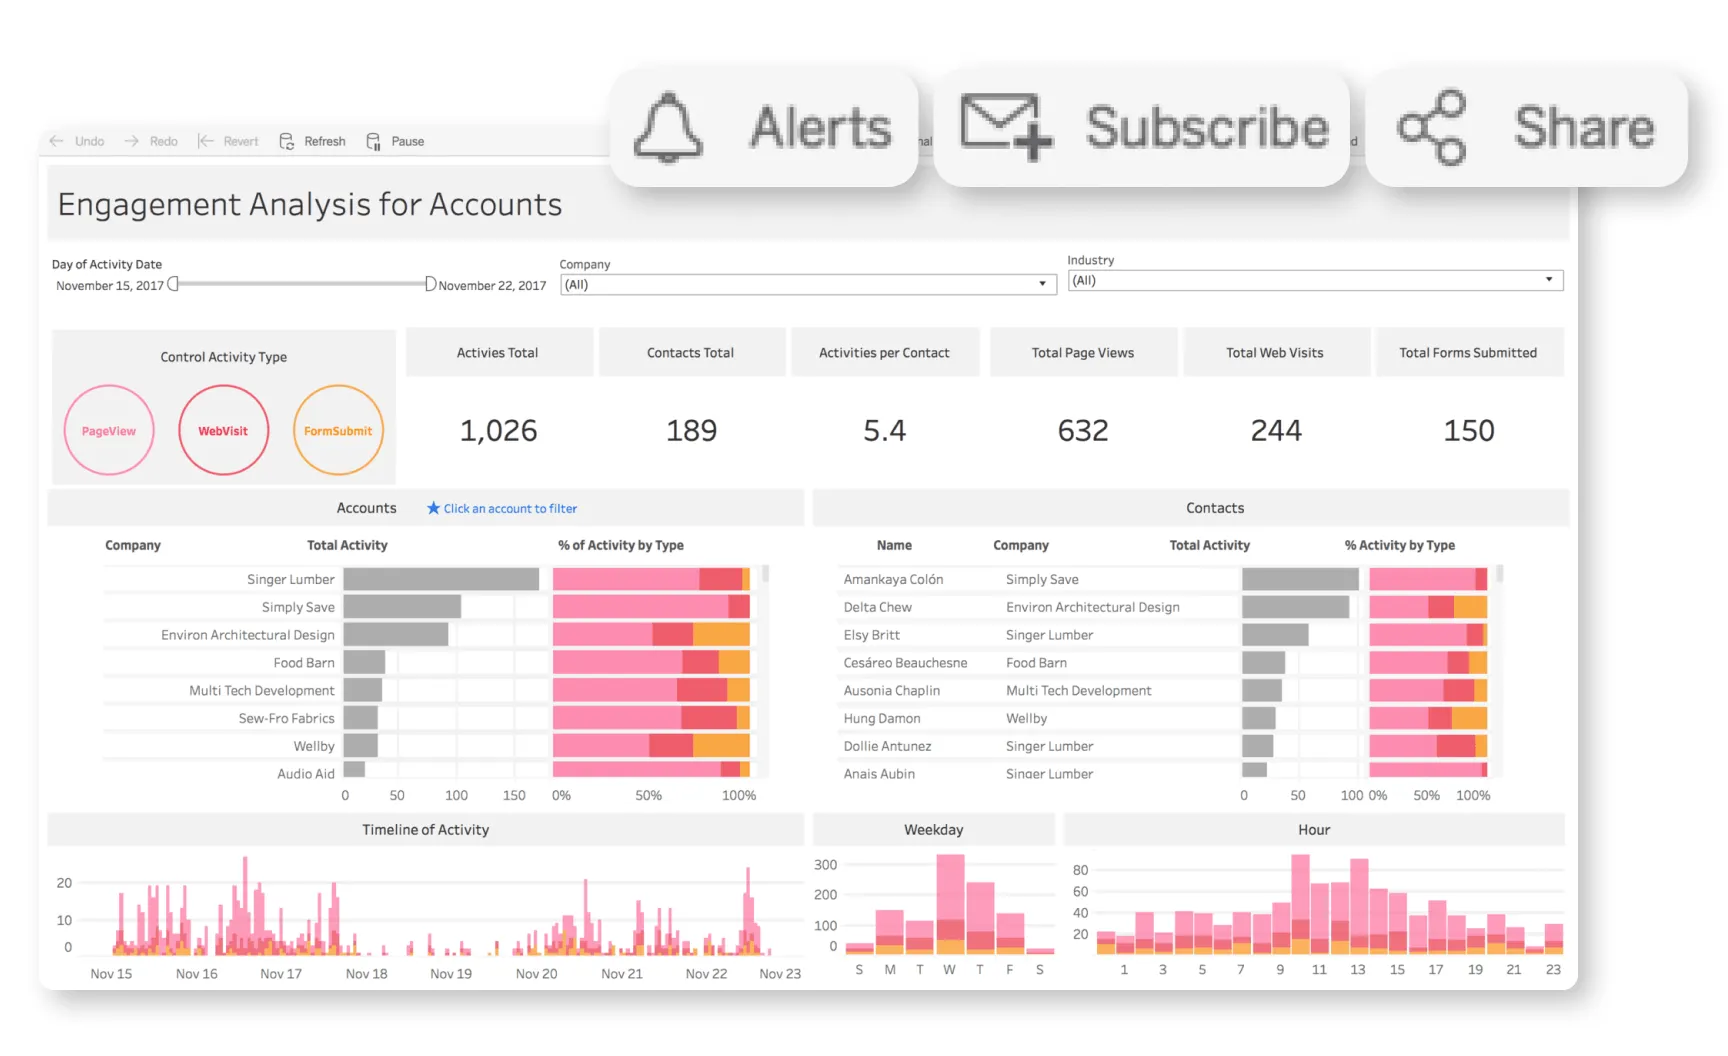
Tableau's interactive dashboards enable sales teams to explore and interact with data. By applying filters and interacting with visualizations, sales organizations gain valuable insights. This interactivity aids in identifying high-performing areas, targeting specific customer categories, and evaluating marketing efforts.
Salesforce and Tableau facilitate company-wide data exchange and collaboration. With Tableau, you can publish and share dashboards and reports, ensuring that CEOs, sales managers, and team members have access to the same insights. This transparency fosters data-driven sales strategies.
By leveraging Salesforce's CRM features and Tableau's data visualization and analytics technologies together, you can create a powerful tool stack for tracking sales performance. This integration enhances data visibility, analysis, and collaboration, providing you with actionable insights to optimize your sales processes and achieve better results.
Hubspot CRM + Databox:
To effectively track and improve sales performance, a reliable tool stack is essential. HubSpot CRM and Databox provide valuable solutions for businesses looking to optimize their sales processes. By integrating HubSpot CRM with Databox, monitoring real-time sales analytics becomes effortless.
HubSpot CRM serves as the foundation of this tool stack, efficiently managing sales, contacts, and transactions. Its user-friendly design enables sales teams to track progress, document customer interactions, and manage pipelines with ease. Sales data is centralized for convenient access and streamlined management.
The true power of this tool stack lies in the seamless integration of HubSpot CRM with Databox. Databox offers customizable dashboards and infographics, enhancing sales performance tracking. Through integration with HubSpot CRM, Databox presents real-time performance information through visually appealing displays.
Databox empowers users to create customized dashboards that cater to their specific needs. Sales managers can easily track income, completed transactions, conversion rates, and average deal size in one centralized location. These interfaces can be configured to display real-time data, ensuring sales teams are always up to date.
Databox provides flexible visualization options, including line graphs, bar charts, and pie charts, which effectively present sales data. This simplifies complex information and enables sales teams to identify trends and patterns effortlessly.
Moreover, Databox seamlessly integrates HubSpot CRM data with other sources, allowing businesses to combine data from marketing automation, customer care, and e-commerce platforms. This comprehensive perspective on the sales process helps sales teams understand the complete customer experience and make informed decisions.
The integration of HubSpot CRM with Databox streamlines data analysis and reporting. Databox automates data extraction from HubSpot CRM and generates reports, saving valuable time. Key stakeholders receive sales reports automatically, ensuring they stay informed and aligned.
HubSpot CRM with Databox provides a simplified toolkit for tracking sales performance. Sales teams can analyze their performance, identify areas for improvement, and make informed decisions using HubSpot CRM's user-friendly interface and Databox's customizable dashboards. This promotes transparency, cooperation, and data-driven decision-making, helping businesses optimize their sales processes and achieve success.
Pipedrive + Klipfolio:
When it comes to monitoring sales performance, having the right tools is crucial. That's where Pipedrive, a renowned CRM platform, and Klipfolio, an exceptional data visualization software, come into play. By combining the power of Pipedrive with Klipfolio, businesses can create insightful sales dashboards, visualize pipeline data, and unlock valuable sales performance insights.
Pipedrive serves as the foundation of this tool stack, offering a robust CRM solution to manage sales pipelines with ease. Its user-friendly interface empowers sales teams to track leads, handle deals, and collaborate effectively. With features like deal tracking, contact management, and activity reminders, Pipedrive streamlines sales processes and enhances productivity.
However, the real magic happens when Pipedrive integrates seamlessly with Klipfolio. Klipfolio's data visualization capabilities transform sales analytics and pipeline data into visually appealing dashboards. This integration takes sales performance analysis to new heights.
Klipfolio's true strength lies in its flexibility. You can customize sales dashboards according to your specific requirements. Imagine having charts, graphs, and gauges that display crucial information such as revenue, sales funnel stages, conversion rates, and sales goals—all presented in a visually compelling manner. With Klipfolio, you gain quick insights into your sales performance indicators.
One of the standout features of Klipfolio is its ability to reflect real-time data changes from Pipedrive. This ensures that your sales dashboards are always up to date, enabling you to track progress, identify obstacles, and make data-driven decisions in real time. Stay ahead of the game by leveraging real-time sales metrics for enhanced performance.
Klipfolio's capabilities go beyond visualization. It empowers you to manipulate and analyze complex sales data. You can apply filters, drill down into details, and compare different periods or sales areas. These tools enable you to identify trends, optimize processes, and refine your sales strategies based on a deeper understanding of your sales performance.
Moreover, Klipfolio seamlessly integrates Pipedrive data with other sources, allowing you to gain a comprehensive view of your sales ecosystem. By merging data from marketing automation, financial, and customer support platforms, you can evaluate marketing efforts, track deal finances, and analyze the customer journey in one centralized dashboard.
In conclusion, the combination of Pipedrive and Klipfolio forms a powerful toolkit for tracking sales performance. With Pipedrive's robust CRM features and Klipfolio's advanced data visualization capabilities, businesses can create customized sales dashboards, gain actionable insights from pipeline data, and foster a data-driven approach to sales optimization.
Zoho CRM + Power BI:
Zoho CRM, a comprehensive CRM solution, excels at sales monitoring and lead management. When integrated with Microsoft Power BI, a powerful data visualization tool, Zoho CRM provides businesses with dynamic dashboards, in-depth analysis, and data visualization capabilities.
Zoho CRM streamlines sales operations and enhances prospect management. Its user-friendly design and customized workflows enable businesses to efficiently handle leads, contacts, and deals. Sales teams can track pipeline progress, anticipate revenue, and identify opportunities and barriers using Zoho CRM's comprehensive features.
The integration of Zoho CRM with Power BI takes this tool stack to the next level. Power BI empowers businesses to create visually appealing and interactive dashboards and reports. By connecting Zoho CRM data with Power BI, businesses can analyze, discover, and present data in a meaningful way.
Power BI allows users to build dashboards showcasing sales figures, performance indicators, and trends. With visualization options like charts, graphs, maps, and tables, businesses can measure and share revenue, conversion rates, transaction stages, and customer acquisition KPIs. The ability to drill down into data points, apply filters, and explore data dynamically supports data-driven decision-making.
Real-time data refreshment is another advantage of Power BI. By synchronizing Zoho CRM data in real-time, businesses can ensure data accuracy and provide sales teams with up-to-date performance tracking. This eliminates the need for manual data imports and updates, saving valuable time and effort.
Power BI's advanced analytics capabilities enable businesses to conduct in-depth analysis of Zoho CRM data. AI-powered insights, data modeling, and advanced computations provide valuable sales performance insights. By merging Zoho CRM data with data from marketing automation tools and financial systems, businesses gain a better understanding of their sales ecosystem and can make informed decisions.
Integrating Zoho CRM with Microsoft Power BI creates a powerful tool stack for tracking sales performance. Businesses can develop interactive dashboards, analyze data effectively, and improve sales visibility and performance. This tool set promotes data-driven decision-making and supports sales team optimization.
Freshsales + Looker:
Freshsales, a modern CRM designed for high-velocity sales teams, streamlines sales and lead management processes. Paired with Looker, a robust business intelligence platform, it enables businesses to create customized reports and gain a deeper understanding of their sales success.
Freshsales serves as the foundation of this tool stack, providing a modern and intuitive CRM experience. With Freshsales, high-velocity sales teams can effectively manage leads, contacts, and pipelines. The CRM's user-friendly interface and automation features enable salespeople to focus on building relationships and closing deals. Lead scoring, email monitoring, and activity capturing capabilities further enhance sales process management.
By integrating with Looker, Freshsales takes its capabilities to the next level. Looker empowers businesses to evaluate and manipulate data effectively. By connecting Freshsales data with Looker, companies can customize reports and gain valuable insights into their sales performance.
Customization of reports is made easy with Looker's drag-and-drop interface. Sales teams can track key metrics such as revenue, conversion rates, sales cycle duration, and deal closure ratios. Looker's wide range of visualization options, including charts, graphs, and heatmaps, enable sales teams to comprehend complex data and identify trends or patterns.
Looker offers advanced data analysis functionalities, allowing businesses to slice and dice data by various dimensions such as period, geography, product type, and consumer segment. This flexibility enables organizations to examine sales performance, identify top-performing sectors or products, uncover growth potential, and make data-driven decisions.
The integration between Freshsales and Looker ensures data accuracy and currency. Real-time data synchronization eliminates the need for manual data transfers or reconciliations, providing sales teams with timely insights. Sales managers and representatives can track sales performance, identify issues, and take proactive measures to drive sales growth.
Looker also facilitates information and insights exchange within the sales team and beyond. Sales managers can openly discuss reports with team members to align goals and strategies. Looker's dashboards and reports can be integrated into other platforms or shared with stakeholders across the organization, promoting a culture of data-driven decision-making and transparency.
Freshsales integrated with Looker offers a sophisticated tool stack for tracking sales performance. Businesses can generate customized reports, gain deep insights, and make informed decisions. The integration supports data-driven decision-making, improves sales visibility, and helps sales teams optimize processes, drive performance, and achieve sales success.
Copper + Grow:
Copper, formerly known as ProsperWorks, is a CRM app exclusively integrated with Google Workspace. When combined with Grow, a powerful business intelligence platform, Copper enables businesses to analyze sales data, track essential metrics, and create detailed performance reports.
Copper serves as the foundation of this tool stack, offering a CRM solution that seamlessly integrates with Google Workspace. Its intuitive design and robust feature set accelerate sales operations and lead management. With Copper, businesses can effectively track leads, contacts, and deals across the sales pipeline. Integration with Gmail, Calendar, and Drive through Google Workspace ensures easy collaboration and data synchronization.
The integration of Copper with Grow unlocks the full potential of this tool stack. Grow is a business intelligence platform that empowers businesses to visualize and analyze data from various sources. By connecting Copper with Grow, businesses gain valuable sales insights and make data-driven decisions.
Grow provides users with the ability to generate visually appealing dashboards and reports showcasing sales data. Its drag-and-drop interface allows for easy customization of visualizations. Sales teams can track metrics such as revenue, conversion rates, sales cycle time, and transaction closing percentages. Charts, graphs, and tables enable a comprehensive interpretation of these numbers, facilitating trend identification and analysis.
In addition, Grow offers advanced analytics capabilities for sales data. Users can apply filters, segment data, and perform in-depth analysis to uncover actionable insights. The platform's comprehensive analytics tools help businesses identify sales performance gaps, refine sales strategies, and make informed decisions.
The integration between Copper and Grow ensures data accuracy and real-time synchronization. Sales teams receive timely updates without the need for manual data transfers or imports, allowing them to analyze progress, identify areas for improvement, and take proactive steps to boost sales performance.
Copper and Grow together form a powerful sales performance monitoring tool. Integrating Copper's CRM capabilities with Grow's business intelligence platform empowers businesses to gain in-depth insights, track key metrics, and create comprehensive performance reports. This tool stack promotes data-driven decision-making, improves sales visibility, and helps sales teams optimize processes, enhance performance, and achieve sales objectives.
Agile CRM + Sisense:
Agile CRM offers a range of features such as sales monitoring, lead scoring, and marketing automation to enhance customer interaction and streamline sales operations. By integrating Agile CRM with Sisense, a powerful business intelligence platform, businesses can create interactive dashboards and reports, gain actionable insights, and optimize their sales processes.
At the core of this tool stack is Agile CRM, which covers the entire sales cycle, including contact management, lead tracking, deal management, email communication, and customer metrics. Its user-friendly interface and automation capabilities allow sales teams to focus on building relationships and closing deals. Agile CRM empowers sales teams to track leads, manage relationships, and automate marketing campaigns to nurture prospects and improve conversions.
The synergy between Agile CRM and Sisense takes the tool stack to the next level. Sisense, a popular business intelligence application, provides businesses with the ability to visualize and act upon complex data. By connecting Agile CRM with Sisense, businesses gain access to real-time sales analytics, allowing them to create interactive dashboards and reports.
Sisense enables users to design intuitive and interactive interfaces for sales analytics and key performance indicators (KPIs). Sales teams can track metrics such as revenue, conversion rates, transaction size, and pipeline velocity. The dashboards can be customized to display data based on time, region, or product category, enabling a deeper understanding of sales performance and identification of improvement opportunities.
In addition to visualizations, Sisense offers advanced data analytics capabilities. Users can perform ad-hoc analysis, slice and dice data, and identify sales data trends. This in-depth analysis helps businesses uncover sales opportunities, optimize sales strategies, and make data-driven decisions.
The integration between Agile CRM and Sisense ensures data quality and currency. Real-time data synchronization eliminates the need for manual data transfers or reconciliations, providing sales teams with instant visibility into performance. Sales representatives and managers can track progress, identify obstacles, and take proactive measures to boost sales.
Agile CRM combined with Sisense creates a powerful sales performance monitoring tool stack. By leveraging Agile CRM's comprehensive CRM capabilities and Sisense's advanced business intelligence tools, businesses can generate interactive dashboards and reports, monitor key sales indicators, and optimize their sales processes. This tool stack fosters data-driven decision-making, improves sales visibility, and empowers sales teams to excel, expand, and outperform the competition.
Microsoft Dynamics 365 Sales + QlikView:
Microsoft Dynamics 365 Sales provides a robust CRM solution that manages leads, opportunities, sales forecasts, pipelines, and customers. When integrated with QlikView, a popular data analytics tool, businesses can create interactive sales performance dashboards and gain actionable insights.
At the core of this tool stack is Microsoft Dynamics 365 Sales, a powerful CRM platform that offers comprehensive sales management capabilities. Sales teams can effectively track leads, manage relationships, and automate sales processes to drive revenue growth. The integration of Microsoft Dynamics 365 Sales with Outlook and Excel enhances data management and improves user experience.
QlikView, a renowned data analytics tool, empowers businesses to create dynamic dashboards from raw data. By connecting Microsoft Dynamics 365 Sales with QlikView, businesses can leverage actionable sales performance dashboards.
QlikView enables users to design interactive dashboards that provide real-time sales analytics and key performance indicators (KPIs). Salespeople can monitor metrics such as revenue, conversion rates, win/loss ratios, and average transaction size. These dashboards offer insights into sales performance by time, region, and sales representative. With drill-down capabilities, filters, and selection options, users can perform data analysis and discover valuable insights.
QlikView also offers advanced sales data analysis capabilities. Users can compare sales-related data from multiple sources, perform cohort analysis, and leverage various analytic methodologies. This deeper analysis helps businesses identify sales opportunities, optimize sales strategies, and make data-driven decisions.
The integration between QlikView and Dynamics 365 Sales ensures real-time data sharing. Sales teams receive instant updates without the need for manual data transfers or reconciliations, enabling them to monitor and address sales performance in real time.
The combination of Microsoft Dynamics 365 Sales and QlikView offers a powerful sales performance tracking solution. By integrating Microsoft Dynamics 365 Sales' comprehensive CRM capabilities with QlikView's advanced data visualization and analytics platform, along with robust data warehouse tools like Snowflake, Amazon Redshift, or Microsoft Azure Synapse Analytics, businesses can create interactive sales performance dashboards, unify and analyze large datasets, gain actionable insights, and optimize their sales processes. This tool stack supports data-driven decision-making, improves sales visibility, and empowers sales teams to thrive in today's competitive market environment.
Close CRM + Chartio:
Close CRM, a comprehensive sales management tool, offers integrated calling and email automation features that assist sales teams in their daily activities. By combining Close CRM with Chartio, a powerful data visualization and analytics platform, businesses can effectively manage sales, track pipeline KPIs, and monitor team performance.
Close CRM serves as the foundation of this tool stack, enabling businesses to streamline their sales processes, manage leads and deals, and automate repetitive tasks. With its integrated calling and email automation capabilities, Close CRM empowers sales teams to build relationships and close deals more efficiently. The platform's user-friendly interface and automation features enhance productivity and allow salespeople to focus on building meaningful connections with customers.
Chartio, on the other hand, provides detailed sales performance insights through engaging sales reports and dashboards. By connecting Close CRM to Chartio, businesses gain access to powerful sales analytics that help them understand key metrics and performance indicators.
Through Chartio, sales teams can create customizable sales KPI dashboards and visual reports. These visualizations display crucial information such as revenue, pipeline status, conversion rates, and overall performance. With the help of charts, graphs, and other visual elements, sales teams can interpret the data effectively and identify trends or patterns.
Chartio offers advanced data analytics capabilities, allowing businesses to conduct in-depth analysis and comparisons. By applying filters, segmentation, and other analytical techniques, sales teams can gain valuable insights into sales performance, identify top-performing sectors or products, and make data-driven decisions to drive growth.
The integration between Chartio and Close CRM ensures real-time synchronization of sales data, eliminating the need for manual data transfers or imports. This real-time visibility enables sales reps and managers to track progress, identify potential obstacles, and take proactive steps to boost sales performance.
By combining Close CRM's sales-focused capabilities with Chartio's data visualization and analytics platform, businesses can develop visual reports and dashboards, monitor key sales indicators, and gain actionable insights. This tool stack promotes data-driven decision-making, improves sales visibility, and helps sales teams optimize their processes, resulting in enhanced performance and achievement of sales targets.
Wrapping it up…
Finally, tracking sales performance is crucial to success in today's competitive company climate. Top tool stacks that link CRM platforms with advanced data visualization and analytics tools help businesses get insights, streamline sales processes, and make informed decisions.
Each of the above-mentioned tool stacks offers unique features for tracking and analyzing sales performance. These tool stacks allow businesses to create interactive dashboards, view sales KPIs, track pipeline activities, and gain actionable insights to boost sales.
These tool stacks provide data-driven decision-making, sales visibility, and growth. Install the right tool stack for your organization and pursue sales excellence to stay ahead of the competition.
.svg)

.webp)