

Most sales teams track productivity. Very few know what they’re actually looking for.
More calls, more meetings, more pipeline coverage look good in theory. But if you’re not measuring the right things, it’s easy to confuse activity with progress. Real productivity is rarely about putting in the time. It’s about whether your reps are doing the work that moves deals forward.
In this blog, we have curated 15 sales rep productivity metrics that are worth tracking in 2025. If you keep a close tab on these metrics, they can help you identify deal risks, time-suck activities, skill gaps in reps, and leaks in your funnel.
What Is Sales Rep Productivity & How to Measure?
Sales rep productivity refers to how effectively a sales representative uses their time and effort to generate revenue. It measures the balance between sales activities (like calls, meetings, and emails) and actual outcomes (like qualified opportunities, closed deals, and quota attainment).
High productivity means reps are focusing on the right accounts, progressing deals efficiently, and consistently contributing to pipeline growth and revenue.
Too many teams confuse activities for progress. They assign activity targets (e.g., 20 calls, 10 emails, 5 meetings a day) and label it “productivity.”
Real productivity is about hitting milestones that lead to revenue. So how do you measure it?
Start with two lenses: effectiveness and efficiency.
Effectiveness tells you if reps are doing the right things. Efficiency tells you how well they're doing those things. You need both.
For instance, a rep who closes deals but burns out doing so won’t be able to scale the process. And a rep who’s efficient but ineffective adds more data data to the pipeline.
Most sales teams focus only on the easy-to-track stuff:
- Dials per day
- Emails sent
- CRM updates
Monitoring these activities are fine for a pulse check, but they don’t really explain rep performance. Productivity metrics should help you answer better questions, such as:
- Are reps spending time on deals that are actually winnable?
- Are they progressing opportunities through the pipeline?
- Are they improving over time?
- Are they hitting quota without burning 60 hours a week?
Once you start measuring productivity through the right lens, you’ll stop asking: Why aren’t reps hitting quota? You’ll start asking: What are we doing wrong? Which deals should we focus more on? What’s slowing things down?
15 Key Sales Rep Productivity Metrics to Track in 2025
Here are 15 sales rep productivity metrics that can help you see how your reps are working, where deals are getting stuck, and what’s affecting your revenue results.
1. Quota Attainment
Quota attainment measures how much of a sales rep's target revenue they actually bring in during a set period.
Formula:
(Total Sales / Sales Quota) x 100
Use Case:
Let’s say your rep closed $85,000 in deals against a $100,000 quarterly target. Their quota attainment is 85%. If multiple reps are stuck at 60-70%, you’re not looking at a motivation issue. You may be over-assigning territories or pricing above market tolerance.
Industry Benchmarks:
According to Salesforce, only 28% of reps expect to hit quota in any given year.
2. Win Rate (Opportunity Conversion)
Win rate shows the percentage of qualified opportunities that turn into closed deals.
Formula:
(Number of Deals Won / Total Opportunities) x 100
Use Case:
If a rep closes 10 out of 40 qualified deals in a quarter, their win rate is 25%. Track this over time and by deal size. A dip in win rate often indicates a mismatch in qualification or a problem in later-stage conversations.
Industry Benchmarks:
B2B average win rate sits around 21%, according to HubSpot's 2024 State of Sales Report.
3. Sales Close Rate (Lead-to-Customer Conversion)
This metric tracks how well your reps convert initial leads into paying customers.
Formula:
(Number of New Customers / Total Leads) x 100
Use Case:
Close rate gives you visibility into the full funnel. If a rep handles 200 leads and closes 12, their close rate is 6%. Low close rates often point to problems in lead quality or early-stage messaging.
Industry Benchmarks:
Close rates vary by industry, but most hover around the 20% mark. Software sees an average of 22%, finance around 19%, and biotech sits lower at 15%.
4. Pipeline Coverage Ratio
This shows whether a rep has enough pipeline to realistically hit their quota.
Formula:
Total Pipeline Value / Quota
Use Case:
If a rep has $300,000 in qualified pipeline and a quarterly quota of $100,000, their pipeline coverage ratio is 3:1. Anything below 2:1 in most B2B cycles is risky.
Industry Benchmarks:
Pipeline coverage benchmarks vary by sales motion. Experts estimate that enterprise teams typically aim for 3x to 5x coverage, mid-market teams target 2.5x to 4x, and SMB sales usually sit between 2x and 3x.
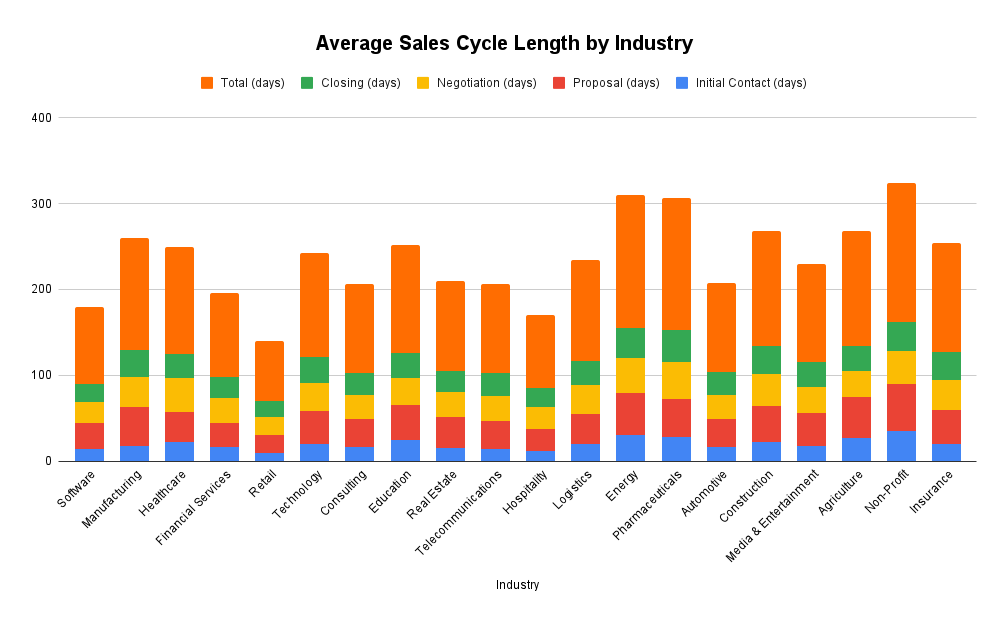
5. Sales Cycle Length
Tracks how long it takes a deal to close from the first touchpoint.
Formula:
Total Number of Days to Close Deals / Number of Deals
Use Case:
If a rep closes 8 deals in 240 days, their average cycle is 30 days. You can compare this against deal size or product line to identify patterns.
Industry Benchmarks:
According to a Focus Digital study, software has the shortest average sales cycle at around 180 days, while non-profits and pharmaceuticals stretch beyond 300 days.
The gap shows how deal complexity and stakeholder involvement can significantly slow down sales—especially in regulated or budget-sensitive industries.
6. Average Deal Size
This metric shows the average dollar value of each closed deal.
Formula:
Total Revenue from Closed Deals / Number of Closed Deals
Use Case:
A rep closes 5 deals worth $250,000. Their average deal size is $50,000. Use this to segment reps by deal type (SMB vs Enterprise).
Industry Benchmarks:
In SaaS, the average deal size usually depends on your target segment. SMB deals often range from $1,000 to $5,000, mid-market deals fall between $10,000 and $50,000, and enterprise deals can exceed $100,000.
7. Deal Slippage
This measures how often deals are pushed out of the expected close date.
Formula:
(Number of Deals Delayed / Total Forecasted Deals) x 100
Use Case:
If 6 of 20 forecasted deals get pushed to next quarter, slippage is 30%. It signals forecasting issues or deal fragility.
Industry Benchmarks:
According to Ebsta’s 2023 B2B Sales Benchmark Report, only 47% of forecasted deals actually close in the same quarter. That means over half the pipeline is either slipping or getting stuck.
8. Lead Response Time
The average time it takes for a rep to respond to an inbound lead.
Formula:
Total Response Time for All Leads / Number of Leads
Use Case:
If reps take 4 hours on average to respond, you’re losing deals. Research by InsideSales found that responding within 5 minutes boosts conversion odds by 9x (source).
Industry Benchmarks:
The average B2B response time is around 42 hours. That’s far too slow.
9. Selling Time (Percentage of Time Spent Selling)
This measures how much time reps spend on actual selling vs admin or internal work.
Formula:
(Hours Spent Selling / Total Work Hours) x 100
Use Case:
A rep who spends 20 out of 40 hours a week selling has a 50% selling time. That’s average. Anything under 35% should raise a red flag.
Industry Benchmarks:
Reps spend just 28% of their time actually selling, according to Salesforce's State of Sales.
10. Sales Activities Completed (Calls, Emails, Meetings)
A raw count of outreach and touchpoints per rep.
Formula:
Total Number of Logged Sales Activities per Rep per Period
Use Case:
Track this alongside conversion metrics. If one rep sends 100 emails and books 5 meetings while another sends 40 and books 10, you know where efficiency lives.
Industry Benchmarks:
On average, SDRs make 40 calls and 40 emails per day.
11. Leads Generated
Measures the number of new leads sourced by a rep (especially important for outbound roles).
Formula:
Total New Leads Added per Period
Use Case:
Reps focused on prospecting should be tracked on volume and quality. If a rep generates 300 leads and 30% get qualified, that’s meaningful. If only 3% convert, there’s a problem in targeting.
12. Opportunities Created
This tracks the number of new sales-qualified opportunities reps add to the pipeline.
Formula:
Total Number of New SQLs per Period
Use Case:
Use this to measure top-of-funnel health. If your pipeline looks empty next quarter, go back and audit how many opps were created this quarter.
Industry Benchmarks:
Across industries, the average SDRs typically create 15-25 SQLs per month.
13. Revenue per Sales Rep
Shows how much revenue each rep is directly responsible for.
Formula:
Total Revenue / Number of Sales Reps
Use Case:
Track this quarterly or annually. It’s a good benchmark to spot underperformance and set compensation models.
Industry Benchmarks:
According to SaaStr data, a healthy benchmark is $500K to \$1M in ARR per rep per year. But teams that sell higher ACV products can often see this number go much higher.
14. Sales Growth Rate
Measures how much your sales numbers are increasing over time.
Formula:
[(Current Period Sales − Previous Period Sales) / Previous Period Sales] x 100
Use Case:
Track rep-level growth YoY or QoQ. This helps you reward top performers and identify growth stagnation.
15. Ramp-Up Time (New Rep Onboarding)
How long it takes a new sales rep to become fully productive.
Formula:
Time from Start Date to Quota Attainment
Use Case:
If reps take 6 months to ramp but churn in 9, you're burning cash. Shortening ramp time is often the fastest route to better productivity.
Industry Benchmarks:
Most new reps take 3 to 6 months to ramp up. But this depends heavily on product complexity, sales cycle length, and the quality of onboarding and training.
Bonus Metrics
In 2025, rep productivity isn’t limited to landing new deals.
Your revenue growth depends just as much on retaining and expanding existing accounts as it does on closing new ones. These bonus metrics help you track the full impact your reps have beyond pipeline and into long-term revenue.
16. Customer Retention Rate (For Account Managers)
While not always in the AE’s control, retention is critical for upsells, renewals, and long-term productivity.
Formula:
[(Customers at End of Period - New Customers) / Customers at Start] x 100
Use Case:
Track this for post-sales reps. A 95% retention rate beats a 110% new customer growth rate in most SaaS models.
17. Upsell and Cross-Sell Rate
Captures how much existing revenue is being expanded by reps.
Formula:
(Upsell + Cross-Sell Revenue / Total Revenue from Existing Accounts) x 100
Use Case:
Enterprise reps often influence these numbers even without closing new logos. High upsell rates suggest reps are building trust, not just closing deals.
Here's a breakdown of 17 key sales productivity metrics—what they mean, how to calculate them, and when to use them.
What Are the Limitations of Traditional Sales Training and Coaching?
The old model of sales coaching looked something like this: Reps sit through a one-time onboarding session, shadow the senior reps on a few calls, and told to “figure it out” after that.
That model worked when sales cycles were shorter, when buyer behavior was more predictable, and when you didn’t need many tools for each stage of the sales process.
But today, it falls short. Here’s why.
1. It’s Too Slow
Traditional sales coaching happens after a call, most likely after a deal is lost. You debrief a bad call days later, hoping the rep remembers what they said and why it didn’t work.
By the time feedback arrives, the prospect is already gone cold, the deal is stalled, and the damage is already done.
The coaching feedback is too little, too late, and not contextual to the actual situation where it should matter.
2. It’s One-Size-Fits-All
Most training materials are built around a “typical” buyer journey that no longer exists. Reps are given generic talk tracks, objection handling templates, and persona cheat sheets that barely reflect what real conversations sound like.
Top performers learn to improvise. Everyone else struggles because they aren’t taught to handle the nuances.
3. It Doesn’t Scale With Complexity
As your GTM motion matures, so do the objections, the compliance risks, the competitive threats, and the pricing models.
But if you don’t update your sales training and coaching routinely, it creates a knowledge gap between what your reps know and what your buyers expect.
You’ll see them fumble during a sales call or in their pipeline coverage.
4. It Relies Too Heavily on the Manager
When managers are expected to coach, forecast, recruit, and unblock deals, some things take a backseat. And in sales, it’s mostly coaching. Or worse, it becomes reactive…prioritized only when a rep is underperforming or a high-stakes deal falls through.
That means you don’t have a healthy feedback loop with your reps and leave them to chance.
5. It’s Disconnected From the Moment of Truth
The best time to coach a rep isn’t days later. It’s right after a sales call, or better yet, just before it happens again. Traditional coaching waits for a call to go wrong, then tries to fix it. It doesn’t prevent the mistake in the first place.
Sales today is fast because buyers are well-informed and talking to multiple vendors at once. If your coaching is still stuck in time, you’re leaving deals on the table.
How AI Sales RolePlay & Training can help improve Sales Rep Productivity
Sales reps don’t get better by watching videos or reading playbooks. They get better by doing.But most teams don’t have the time to coach reps consistency. And even when they do, it’s reactive.
AI sales roleplay changes that. It gives every rep a simulated environment to test, fail, adjust, and repeat their sales rep in life-like situations, without risking real pipeline.
The result? Your reps are more confident and better-prepared to think under pressure.
Why AI Sales Training Works Better Than Traditional Coaching
Traditional coaching can’t keep up with how fast reps need to learn, adapt, and perform—AI sales training solves that.
1. Instant Feedback
Reps don’t have to wait for the next 1:1 to get feedback. They can run a mock drill, get immediate feedback on tone, pitch structure, objection handling, and move on to the next one.
That kind of tight feedback loop creates compounding improvement over time and directly impacts key sales performance metrics like win rate and ramp speed.
2. Objective Scoring
Unlike human coaching, which often depends on who’s doing the listening, AI provides consistent, bias-free scoring.
Every rep gets evaluated on the same criteria, which creates a fairer and more transparent system for improving sales productivity across the team.
3. Safe Practice Environment
Most reps learn in high-stakes situations, live calls with real prospects. That’s like learning to drive in traffic.
AI role play gives them a controlled setting where they can practice messy objections, complex pricing conversations, or enterprise discovery without risking actual revenue.
It also gives sales leaders more visibility into rep readiness before deals go live, something traditional sales metrics can’t fully capture.
4. On-Demand Access
Cochin shouldn’t be limited to onboarding. With AI, reps can jump into practice reps at any time, without having to wait on their managers. They can interact with AI for sales training through buyer avatars between meetings, after a lost deal, or before a high-stakes call.
They can also work on specific skills without needing to book time with a manager.
5. Scalable Coaching Without Bottlenecks
One of the biggest blockers in most sales orgs is coaching availability. You’ve got one manager for ten reps, maybe more.
AI sales training gives every rep access to personalized coaching without hiring more managers or sitting through hours of call reviews.
And the best part? This kind of repetition works.
With repetition through AI sales role play, reps build muscle memory that carries into real conversations.
How MeetRecord Helps Reps Ramp Faster and Sell Smarter
Coaching shouldn’t be a one-time event. It should be baked into the way your team works. That’s why platforms like MeetRecord focus on making skill development part of the daily workflow, not a quarterly initiative.
Here’s how that plays out in practice:
1. Realistic Simulations and Roleplay
MeetRecord doesn’t use canned scripts or generic prompts. Reps can simulate actual selling situations, be it a pricing call or a cold discovery chat.
These interactions aren’t monologues. They’re dynamic roleplays that adapt based on the rep’s responses.
Try MeetRecord’s AI Sales Roleplay for free to see how real it feels:

2. AI Scorecards and Skill Benchmarks
Every roleplay ends with structured feedback that doesn’t just say what went wrong, but “why” and “what” to improve.
Reps can track their performance over time across specific skill categories like objection handling, active listening, or pitch clarity. Managers don’t have to guess who’s coachable anymore.
3. Faster Ramp-Up and Continuous Feedback
The days of a 3–6 months ramp are gone. MeetRecord helps new reps start practicing on day one.
They don’t just learn the product; they learn how to sell it. And because they get feedback instantly, they don’t have to wait for a lost deal to figure out what they missed.
Modern Coaching is the Real Fix for Low Sales Productivity
If your sales team isn’t hitting numbers, it’s easy to blame the usual suspects—low-quality leads, long cycles, or even rep motivation. But the root issue often runs deeper: lack of effective coaching.
Coaching and productivity often go hand in hand. When you give you reps the arena to practice, improve, and perform with confidence, their productivity improves and shows up in the pipeline.
If you want to see what that looks like in real time, try MeetRecord’s AI Roleplay for free. It’s built for modern sales teams who will love interacting with life-life AI buyers.
Frequently Asked Questions
.svg)
Track a combination of efficiency (like time spent selling) and effectiveness (like quota attainment or win rate) to understand how reps turn effort into revenue.
KPIs include quota attainment, win rate, pipeline coverage, sales cycle length, and revenue per rep—metrics that reflect both performance and progress.
A basic formula is Revenue Generated ÷ Hours Worked, but modern teams also look at outcome-based metrics tied to quota, pipeline, and deal movement.
These are outcome-focused measures like quota attainment, deal slippage, and sales cycle length that show how effectively reps are driving results.
AI roleplay gives reps a safe, repeatable way to practice sales scenarios with instant feedback, improving skills faster without waiting on manager coaching.

.png)


